
What previous cycles teach us about bottoms, recoveries, and why the indicators now point to a detached-led upturn.
Ourboro Internal Report | April 2026
Key judgment
- Reviewing prior GTA drawdowns, the current cycle already looks more like a bottoming and early-recovery phase than a false bottom.
- The historical context matters: recoveries usually need rates to stop worsening, price declines to flatten, activity to recover, and the macro backdrop to improve.
- The likely path is not a straight line, and continued volatility is normal. However, the evidence increasingly suggests the bottom is behind us, particularly for detached and ground-oriented housing.

1. What previous cycles teach us about crashes and recoveries
The most useful way to read the current residential real estate market in the GTA is to start with precedent. The early-1990s, the 2017 policy reset, and the 2022–26 rate shock all produced material drawdowns, but they bottomed for different reasons. The lesson is that recoveries do not begin simply because prices are lower. They begin when the force that caused the drawdown stops getting worse and recovery indicators start turning together.
The current cycle already looks deeper than 2017 on price and much deeper on sales, but it is not a replay of the early 1990s because the macro damage is far milder.


2. Which leading indicators matter most at a turning point?
Across previous cycles, the leading indicators that mattered most were consistent:
- Interest rates were easing
- Price declines had to stop
- Sales activity had to recover, and the broader economy had to avoid a deeper recession. The 1990s “false bottom” is a good warning case because sales improved before prices had truly bottomed. However, that indicator was not useful on its own because the macro backdrop is what prevented the recovery.
That is why today looks different. The macro picture is nimble. There is uncertainty, however we are not in a recession yet and rates are in a stable place rather than tightening. Further, there is indication that price momentum has shifted in a positive direction. Not every indicator is clean yet, but demand is still rebuilding and buyers still have choice. But the checklist now looks far closer to an early recovery than to a classic false bottom.


3. What the indicators are saying now
The current market is already showing the combination that typically appears around a floor. The average GTA selling price has stopped falling on a month-to-month basis, rising from $973,289 in January 2026 to $1,017,796 in March 2026. Sales improved from 3,082 in January to 5,039 in March, and the raw sales-to-new-listings ratio improved from 28.6% to 34.9% over the same period. 1
Financing conditions have also improved. The Bank of Canada has already cut the policy rate back to 2.25% and is expected to hold it at that level despite temporary inflation volatility. This removes the tightening pressure that prevented real estate recoveries in the past. 2

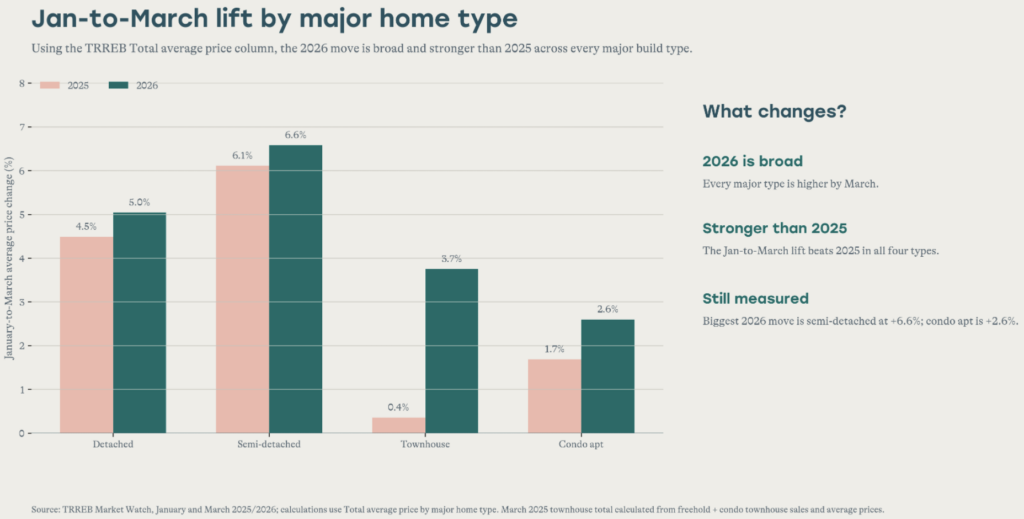
The 2026 rebound is broad: detached, semi-detached, townhouse, and condo apartment prices were all higher in March than in January.
The comparison to 2025 makes the move more constructive. In 2026, the January-to-March lift was stronger than 2025 across all four major home types: detached rose 5.0%, semi-detached rose 6.6%, townhouse rose 3.7%, and condo apartment rose 2.6%.4

4. Why the current setup increasingly favours a detached-led recovery
In our view, the condo market may see some continued turbulence due to elevated supply, but the detached and ground-oriented housing should lead the recovery.
In the medium term, the signs are pointing to a constructive supply-demand environment. Population growth has cooled from the surge years but is still expected to grow in the long-term. However, future supply is tightening materially as housing starts fall, and Ontario’s current housing policies are aimed at expanding ground-oriented supply rather than condos, which is more difficult given limited land.3 Suffice to say, the days of overbuilding are most likely behind us.

5. Risks to monitor
The base case in this report is that the bottom is forming and recovery is underway, but that view still comes with risks that should be noted. The most important macro risk is geopolitical uncertainty. A renewed geopolitical shock could keep energy, shipping, tariff-related, or broader supply-chain costs elevated, keep inflation firmer than expected, and slow the decline in bond yields and mortgage rates that would otherwise help the detached market broaden out. If inflation proves sticky, the move from stabilization to recovery could be slower and more uneven.
That said, our view is that most of these geopolitical pressures are more likely to be temporary than structural. The Bank of Canada has already signalled that it is prepared to look through short-term volatility when setting policy, rather than overreacting to every inflation bump caused by external shocks. In practical terms, that means a temporary flare-up in geopolitical stress does not automatically derail the recovery thesis, especially if underlying domestic demand, labour-market conditions, and housing-market balance continue to improve. The more important question is whether inflation broadens and becomes persistent enough to keep financing conditions tight for longer.
6. What this all means
Reviewing previous drawdowns in the GTA market provide some much-needed perspective. In the early 1990s, although transaction volume kept increasing, most of the other indicators were pointing downwards. The market then declined until past the mid-1990s. In the current market, many of those indicators are turning positive, which informs our view that we are not in a “false bottom.” On top of increasing transactions and prices, we also have stable and low interest rates, constrained housing supply (especially for detached homes), and a solid labor market. The drawdown has already been deep, financing conditions are no longer worsening, activity is improving, and price momentum has stopped deteriorating.4
The recovery is unlikely to be perfectly smooth. Continued volatility would be normal, especially while buyer confidence rebuilds and the condo market remains soft. Geopolitical uncertainty is the clearest outside risk because it could keep inflation elevated and financing firmer for longer than the market currently expects. But the leading indicators are currently pointing in a positive direction. For investors focused on detached and ground-oriented housing, the setup is especially constructive.